  library(terra)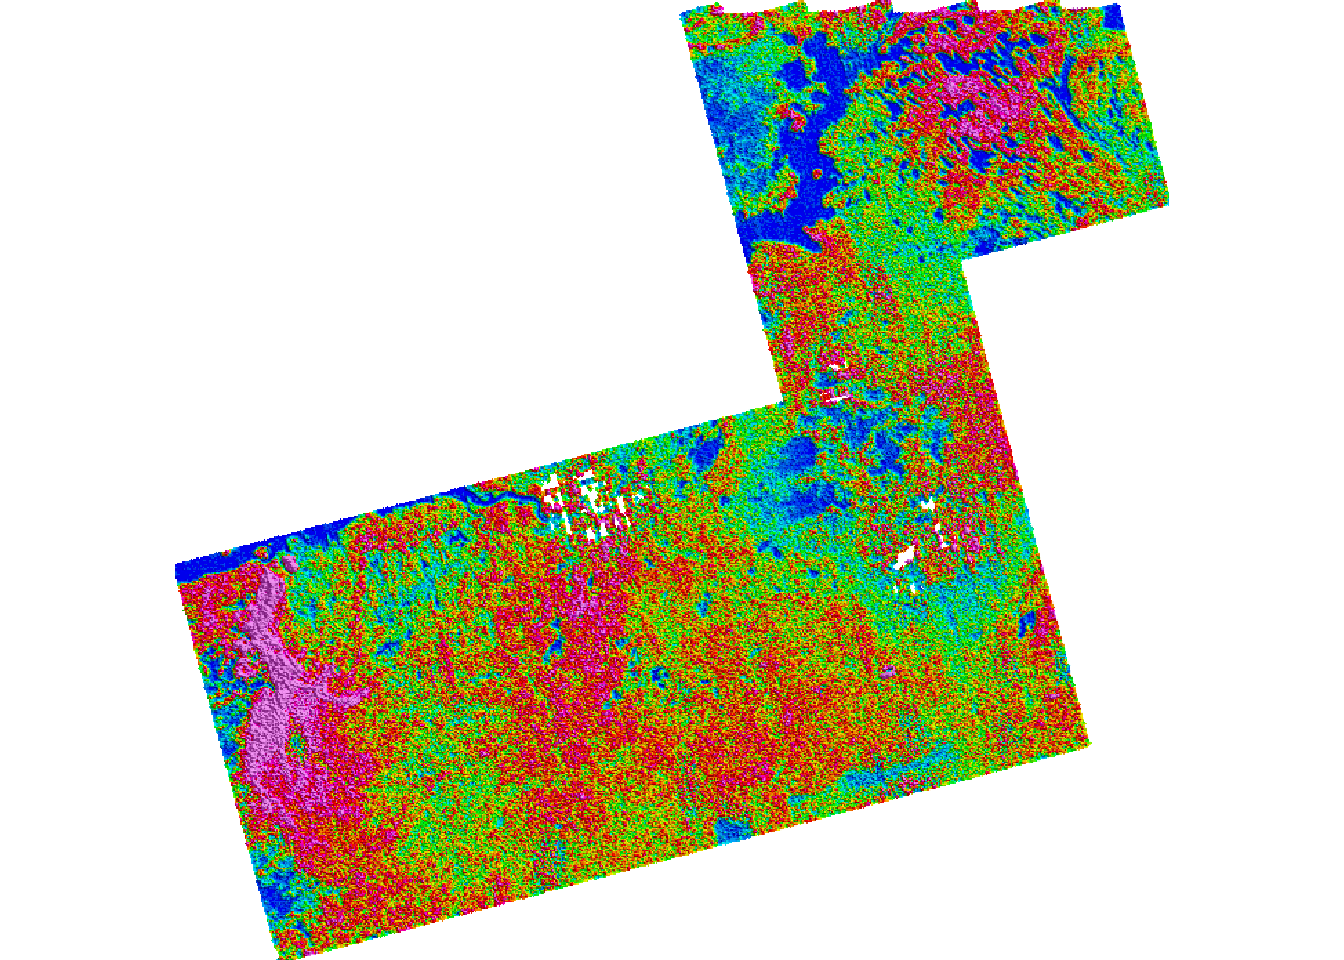
library(tidyverse)I plotted airborne radiometric data from the Tellus survey (Geological Survey, Ireland).
Load packages:
- Download the radiomatric data (Tellus 2019: A5 block (Limerick):
# dir.create("Rdata")
# Radiometric_URL <- "https://gsi.geodata.gov.ie/downloads/Geophysics/Data/GSI_Tellus_A5_RAD_GRIDS_2019.zip"
# download.file(Radiometric_URL, destfile = "Rdata/Radiometrics1.zip")
# unzip(zipfile = "Rdata/Radiometrics.zip", exdir = "Rdata/Radiometrics")- Read data with
terra.
eU_path <- "Rdata/Radiometrics/A5_RAD_GRIDS_2019/TIF/A5_RAD_EQUIVALENT_URANIUM.tif"
eU <- rast(eU_path)

# # Remove data
# unlink("Rdata", recursive = TRUE)- Plot the results
plot(eU)