javielio
Home
My Blog
Publications
Apps
Categories
All
(7)
30DayChallenge
(7)
Data visualization
(7)
R
(7)
My Blog
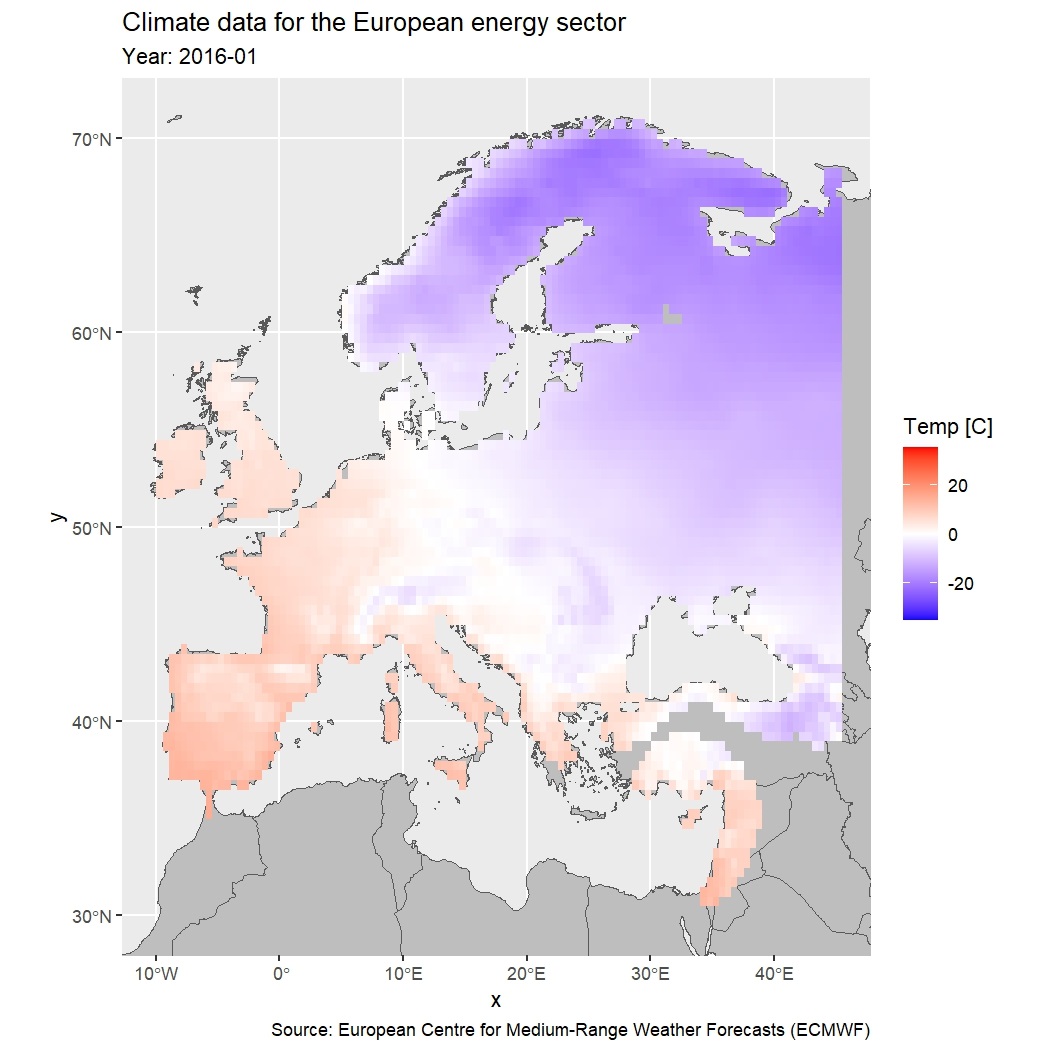
Day 25 of the #30DayMapChallenge - Climate
R
Data visualization
30DayChallenge
Packages we are going to use:
Javier Elío
Nov 25, 2019
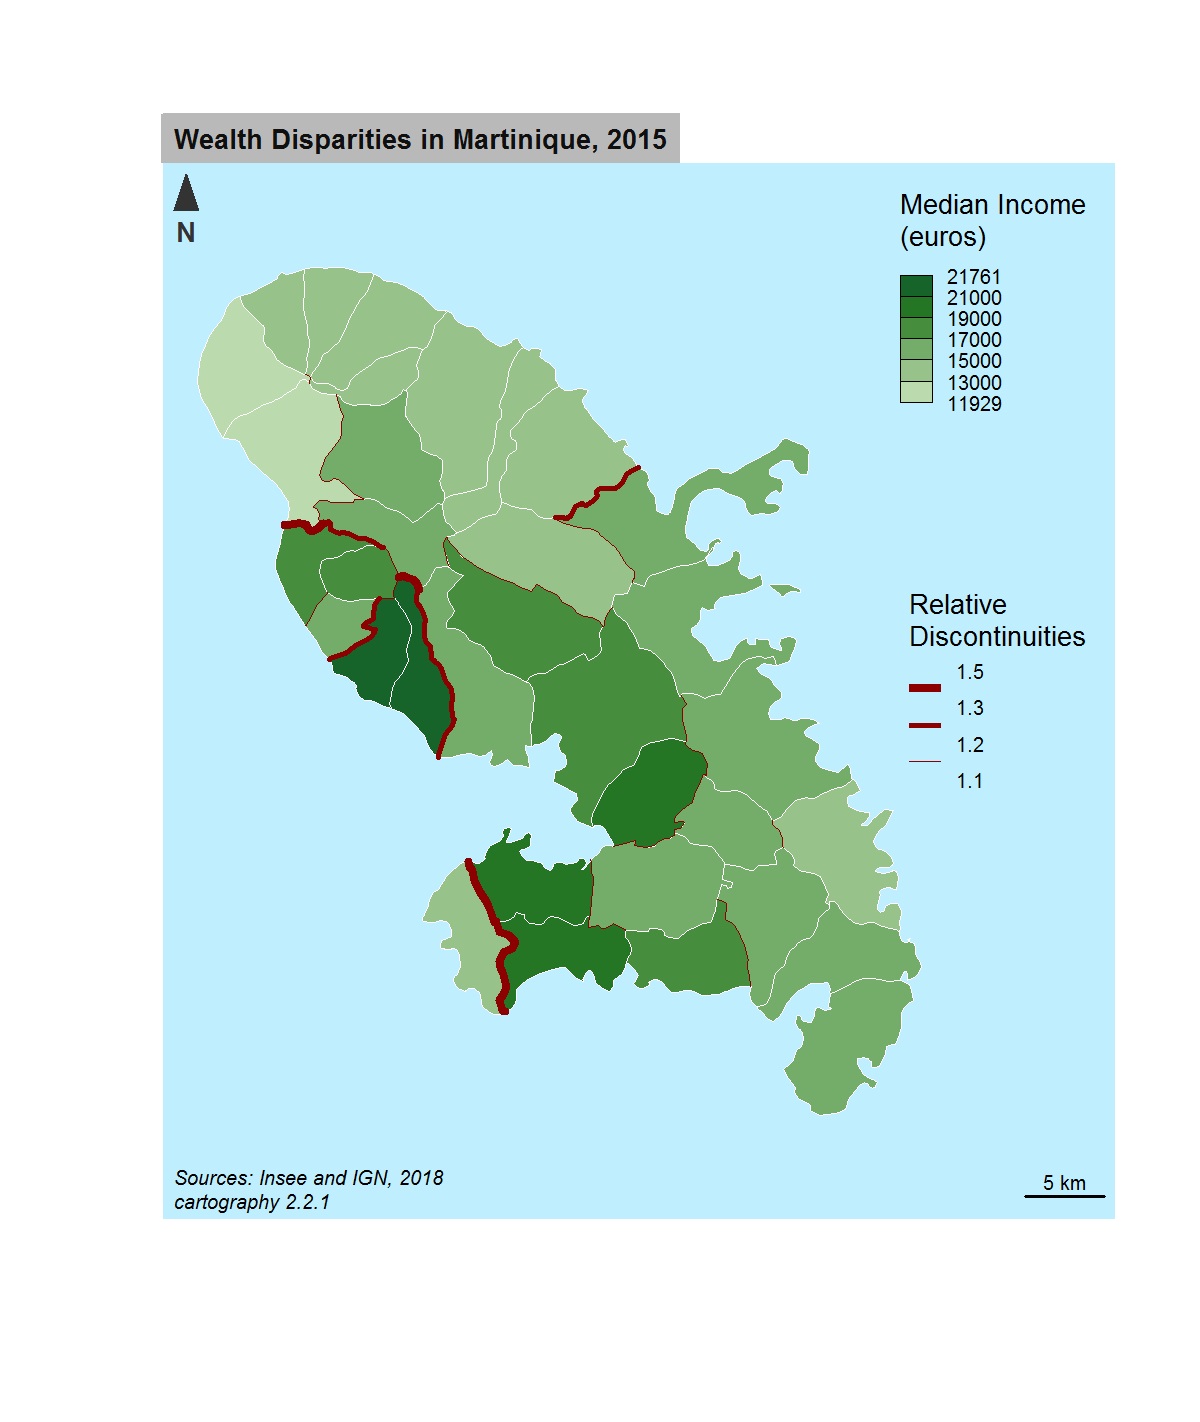
Day 14 of the #30DayMapChallenge - Boundaries
R
Data visualization
30DayChallenge
I tested cartography.
Javier Elío
Nov 14, 2019
Day 13 of the #30DayMapChallenge - Track
R
Data visualization
30DayChallenge
I plotted an interactive map with R.
Javier Elío
Nov 13, 2019
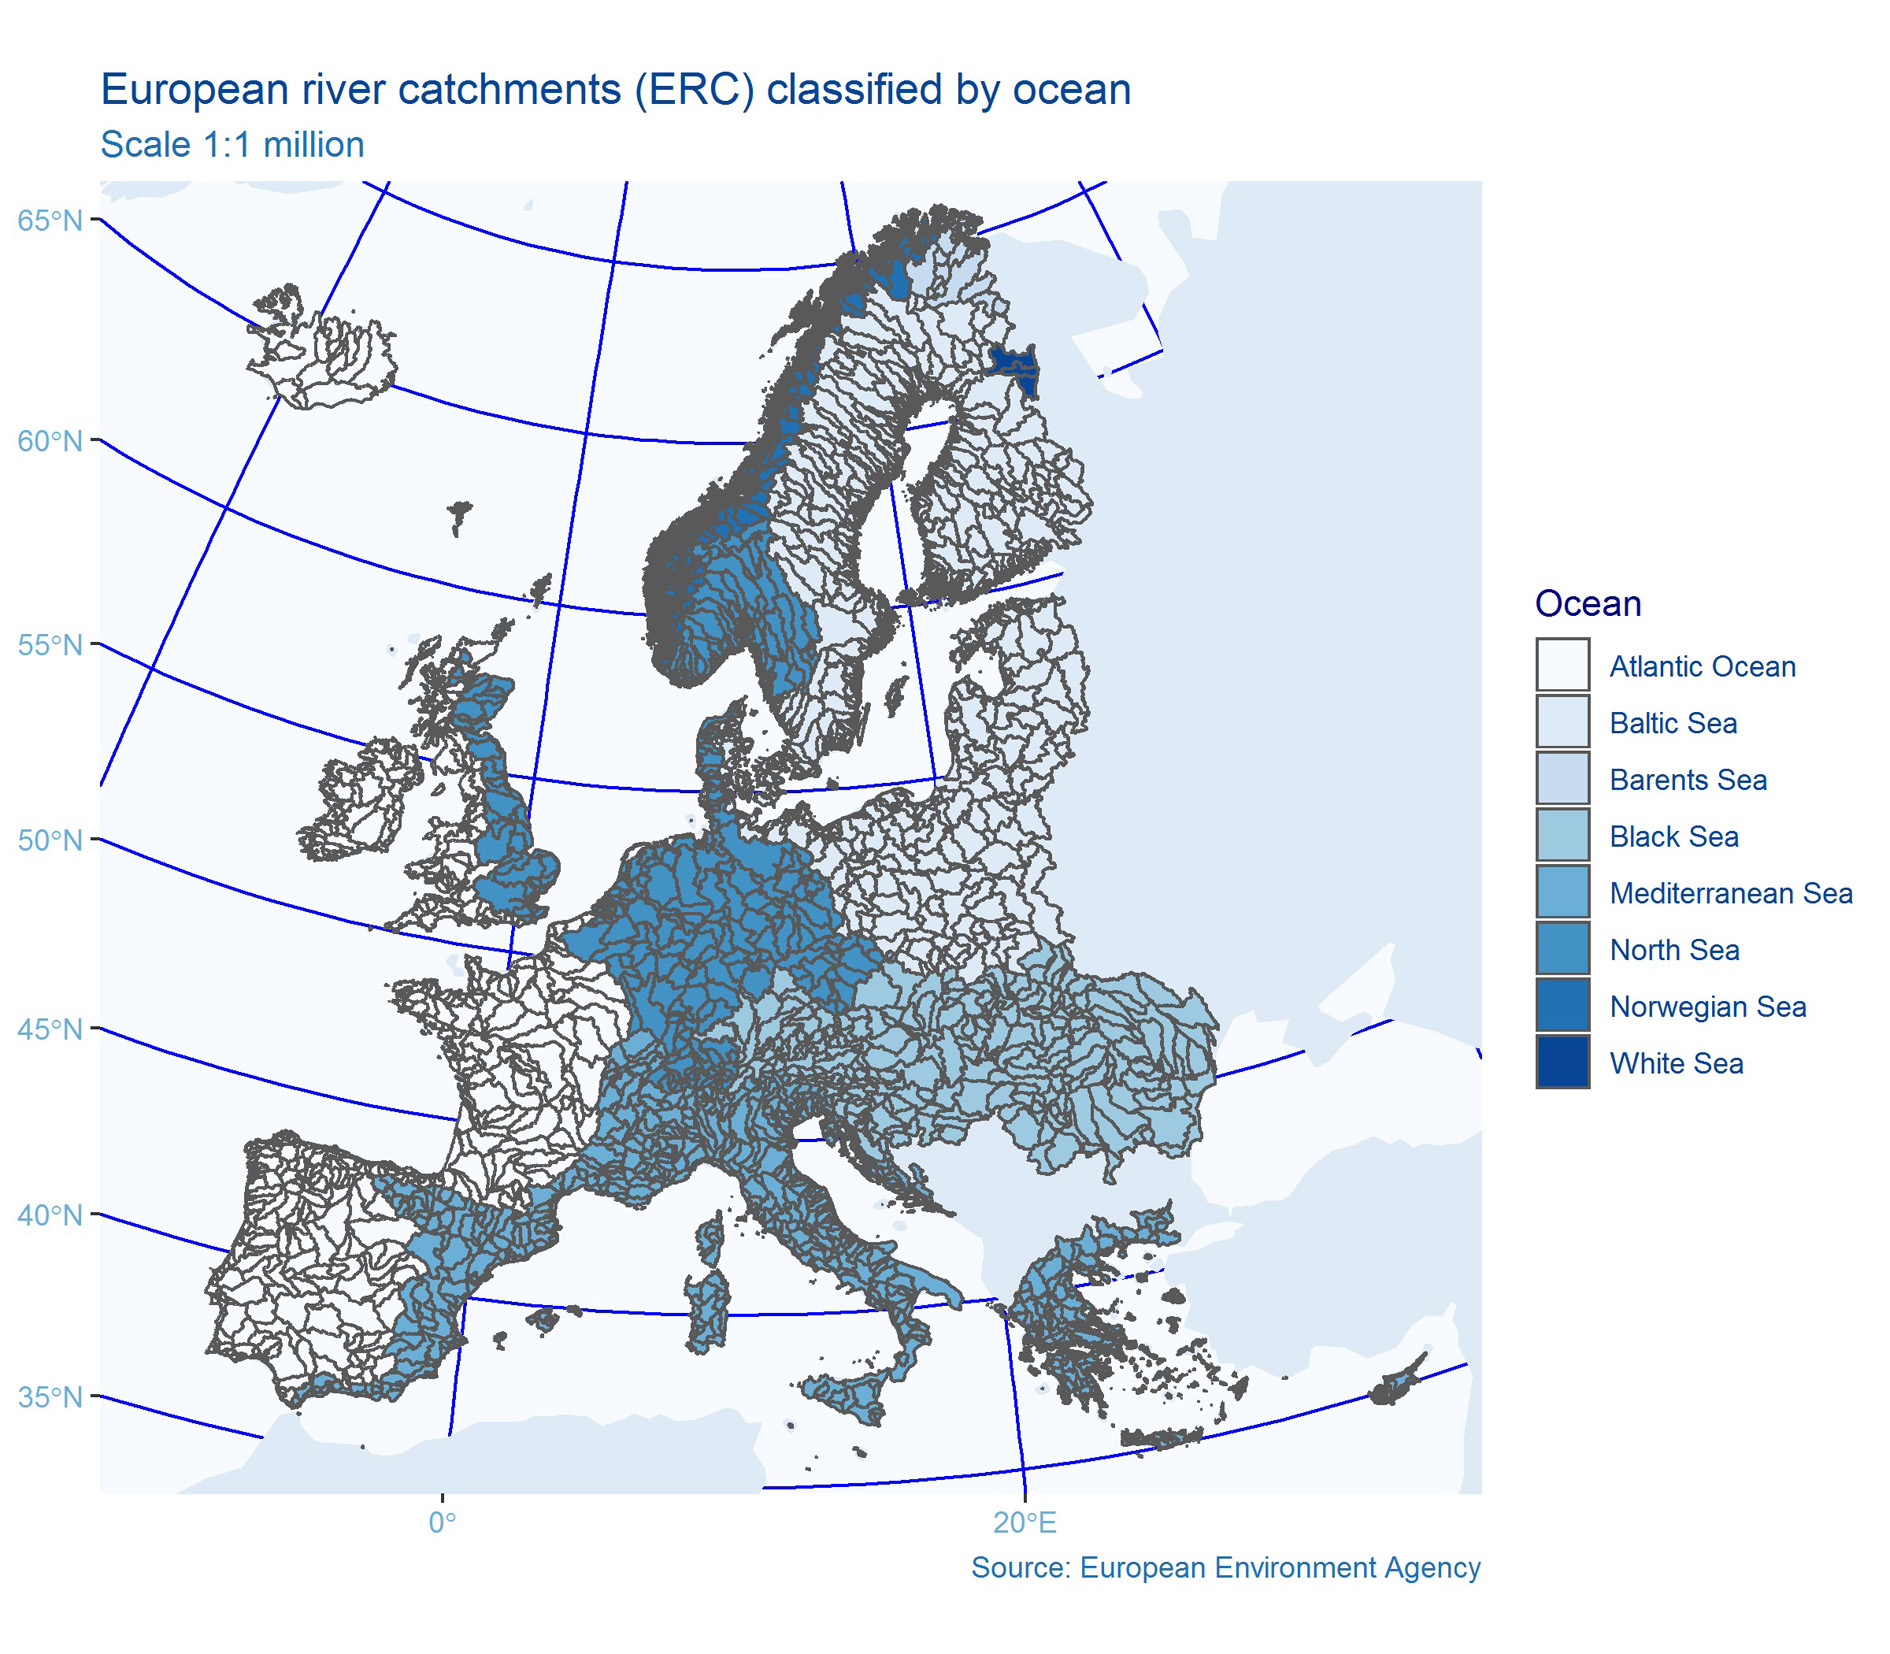
Day 6 of the #30DayMapChallenge - Blue
R
Data visualization
30DayChallenge
I plotted the European river catchments changing the default settings in ggplot2 to different scales of blue (e.g. background, grids, etc.).
Javier Elío
Nov 6, 2019
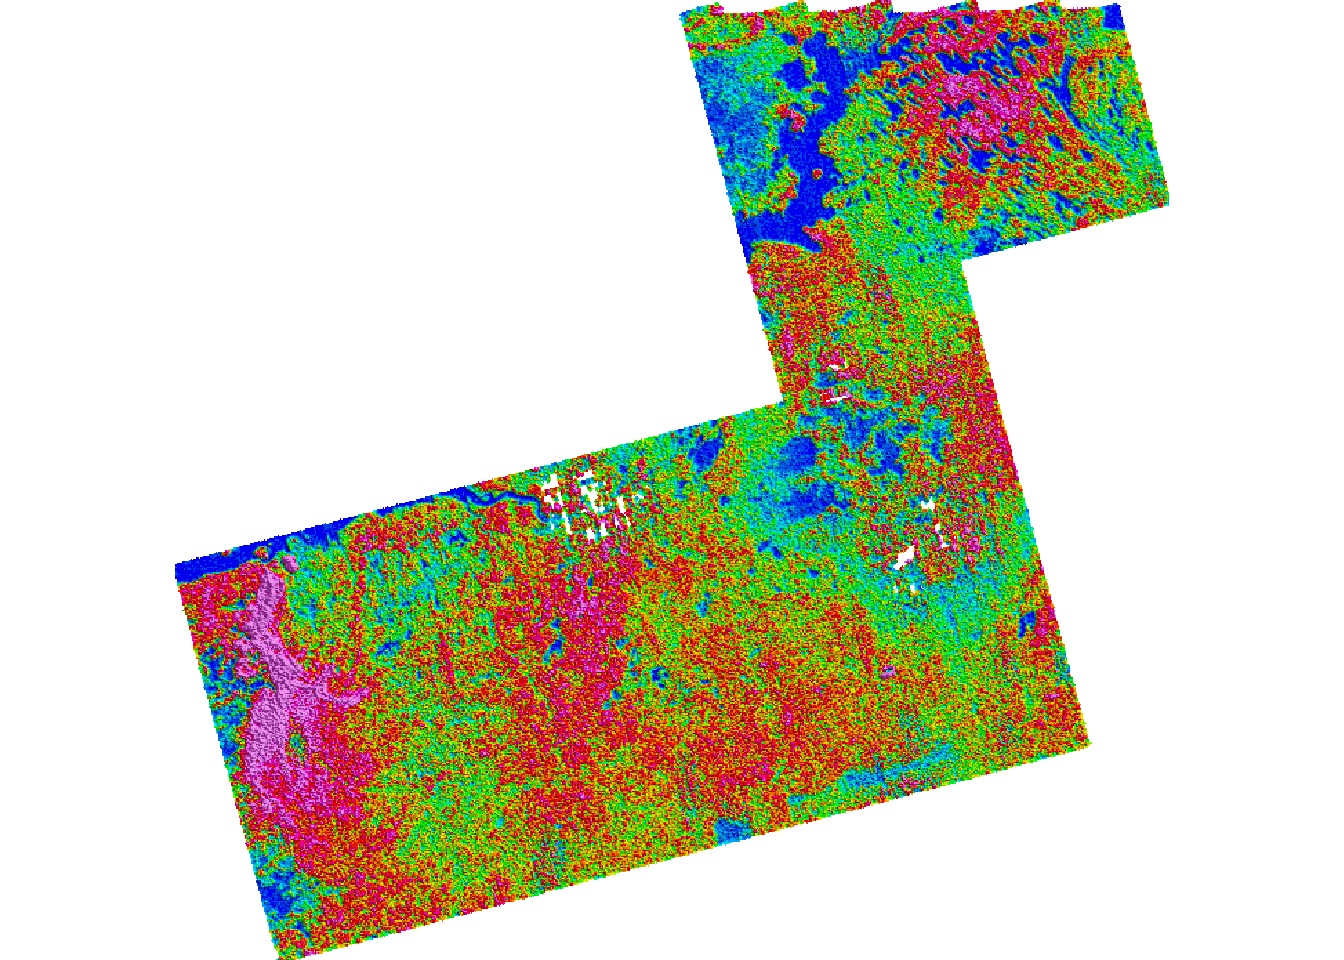
Day 5 of the #30DayMapChallenge - Raster
R
Data visualization
30DayChallenge
I plotted airborne radiometric data from the Tellus survey (
Geological Survey, Ireland
).
Javier Elío
Nov 5, 2019
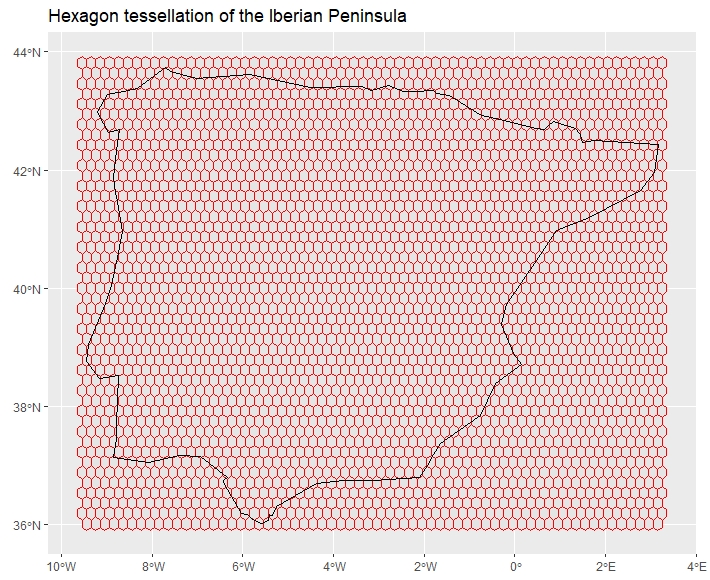
Day 4 of the #30DayMapChallenge - Hexagons
R
Data visualization
30DayChallenge
I made a hexagon tessellation of a region (e.g.Iberian Peninsula):
Javier Elío
Nov 4, 2019
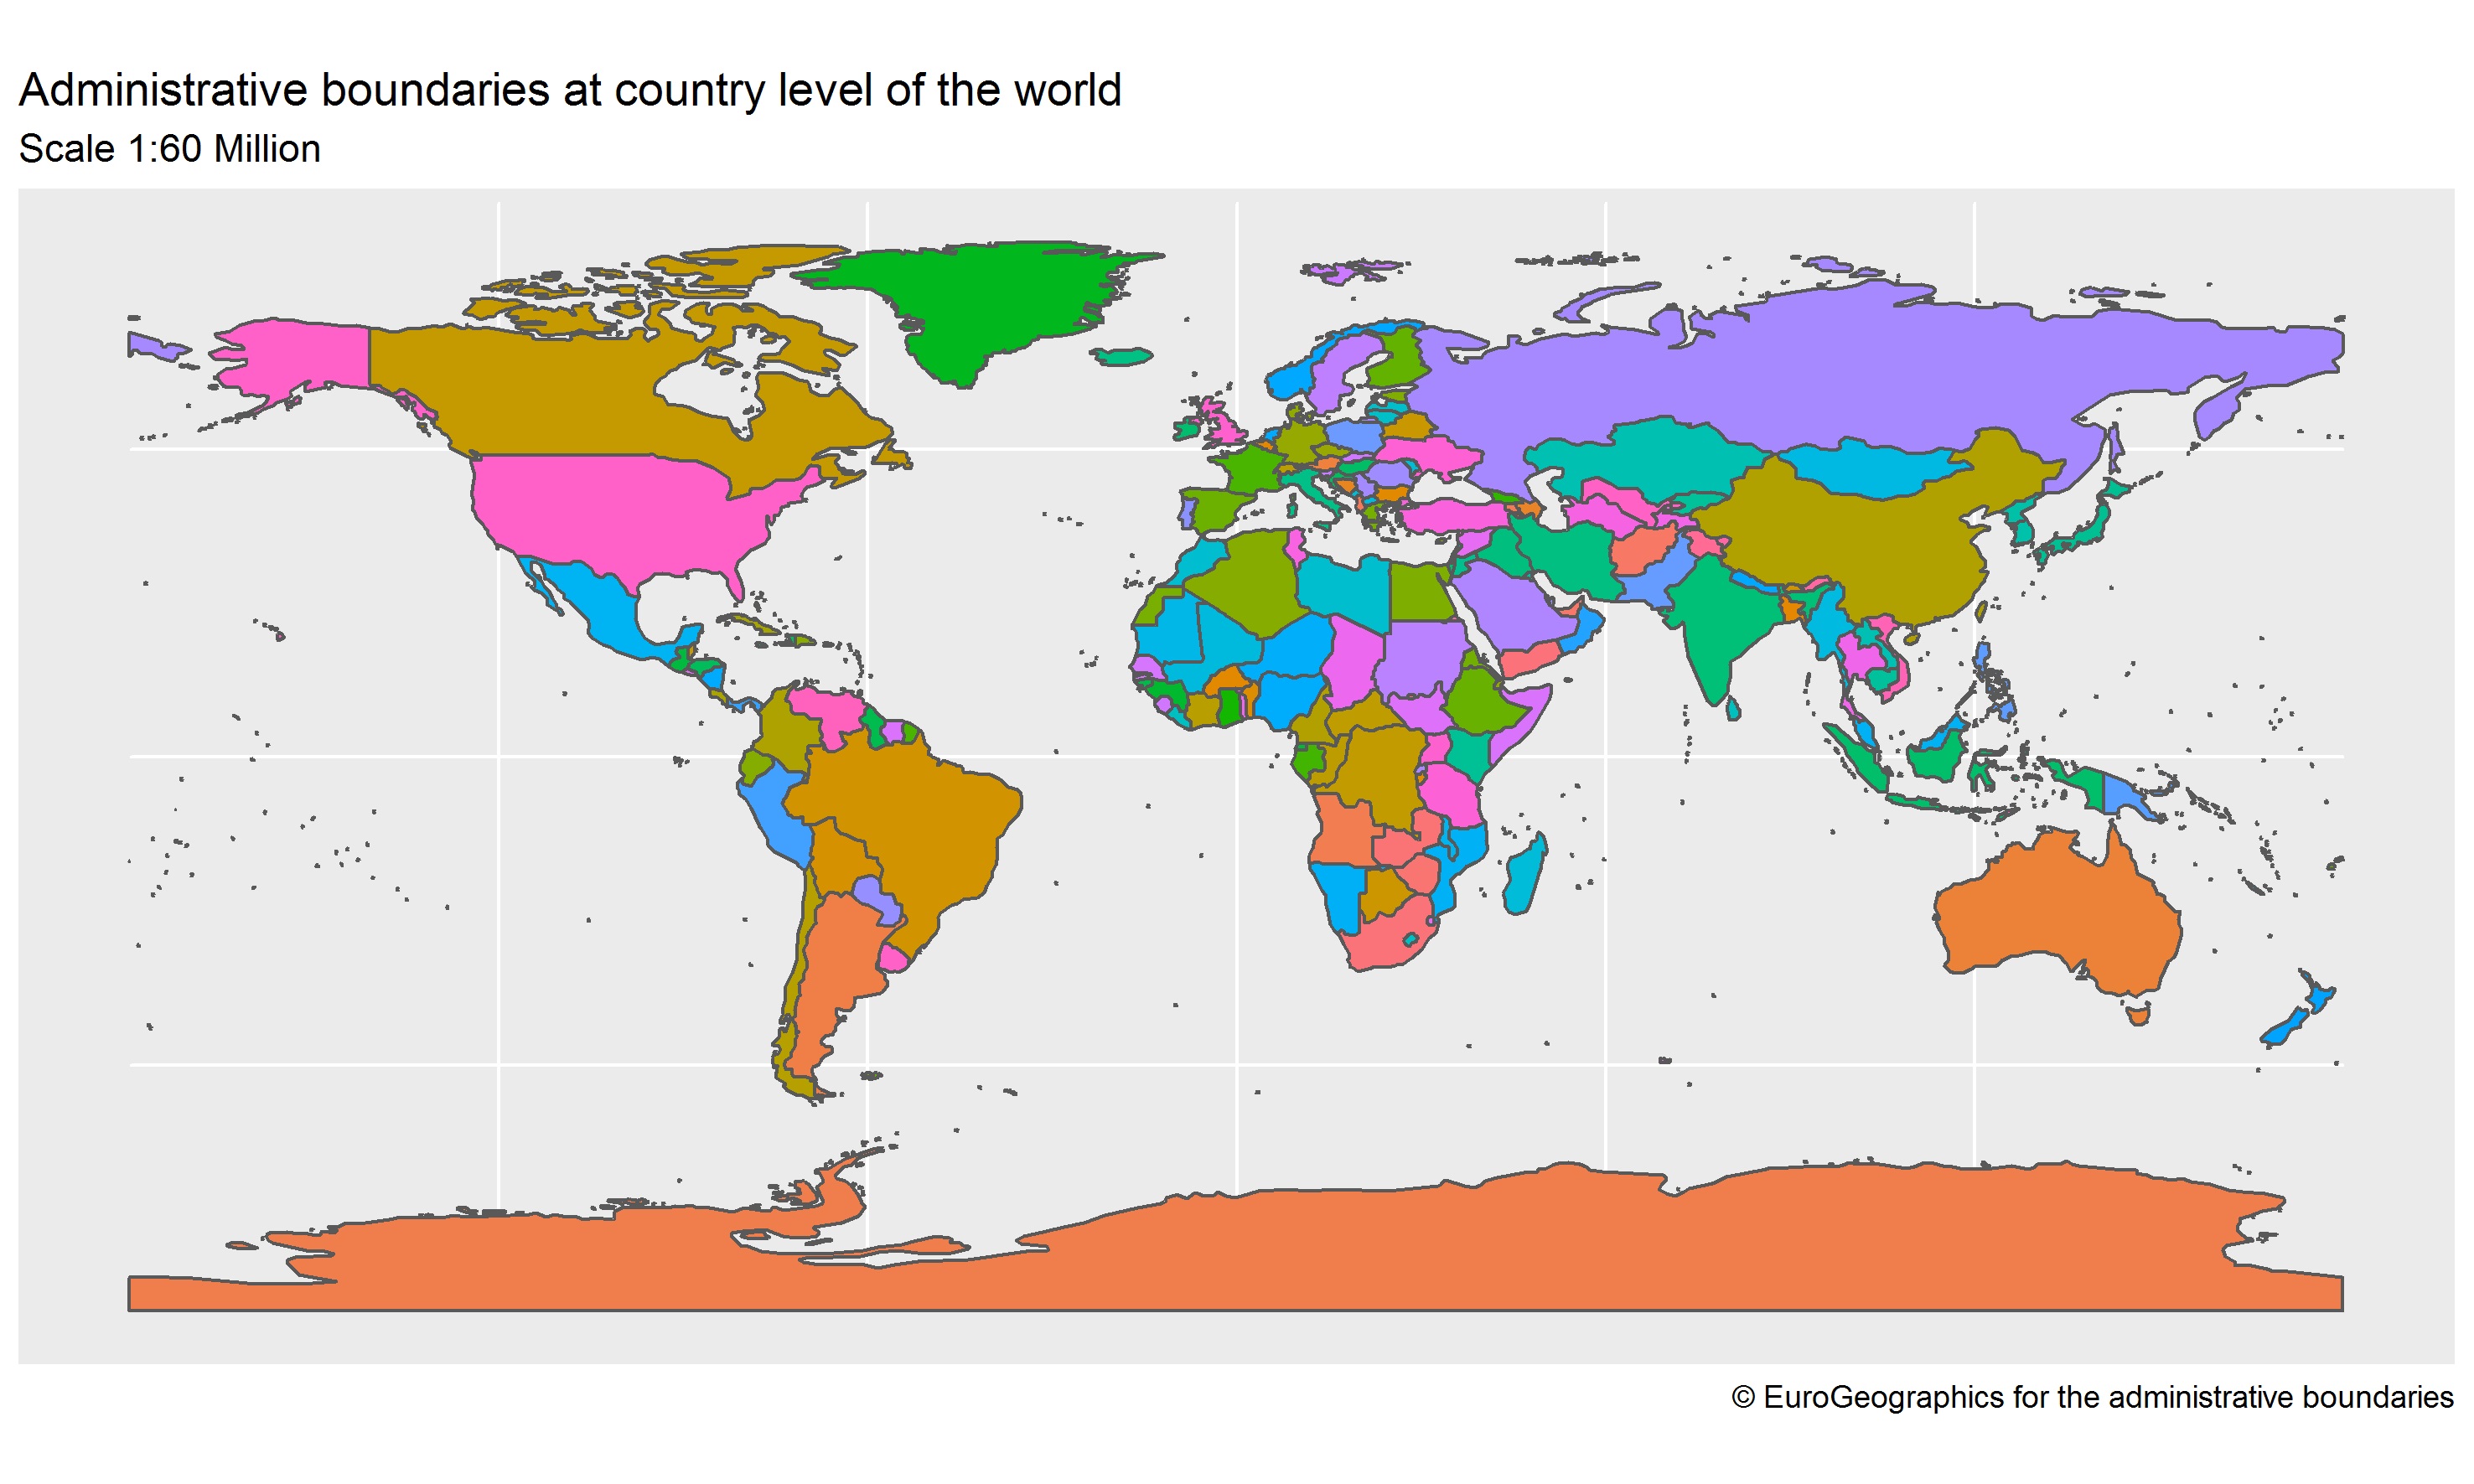
Day 3 of the #30DayMapChallenge - Polygons
R
Data visualization
30DayChallenge
I plotted a wold map (scale 1:60 Million) with color varying by country.
Javier Elío
Nov 3, 2019
No matching items